Problem Set "STATS4STEM MASTER - #1 - GRAPHING & SUMMARIZING DISTRIBUTIONS" id:[PSABKY5]
| 1) Problem #PRAJGYJ "PRAJGYJ - 244753 - Twenty-one elasti..." |
Twenty-one elastic bands were divided into two groups.One of the sets was placed in hot water (60-65 degrees C) for four minutes, while the other was left at ambient temperature. After a wait of about ten minutes, the amounts of stretch, under a 1.35 kg weight, were recorded.  Which of the following statements are correct? Check all that apply. © STATS4STEM.ORG |
Check All That Apply:
|


|
Hints: |
|
|
|
|
|
| 2) Problem #PRAJH5F "PRAJH5F - 245866 - The follow..." |
A)
The data below is a boxplot for the price of diamonds that have an IF clarity rating. This boxplot is: © STATS4STEM.ORG |
Multiple Choice:
|
|
Hints: |
 |
B)
 Review the boxplot and histogram above. 50% of the diamonds in this dataset have a price below: |
Multiple Choice:
|
| 3) Problem #PRAJBJB "PRAJBJB - 239538 - It's seni..." |
A)
It's senior year and college essays are due! Here are hours collected from 20 students spent on writing their college essays:
Which of the following graphs displays the correct stem-and-leaf for the data above? A)
B)
C)
D)
© STATS4STEM.ORG |
Multiple Choice:
|
|
B)
Find the median (M) of the dataset. |
Algebraic Expression:
|
|
Hints: |
|
|
|
|
|
C)
Calculate Q1. |
Algebraic Expression:
|
|
Hints: |
|
|
|
|
|
D)
Calculate Q3. |
Algebraic Expression:
|
|
Hints: |
|
|
|
|
|
E)
Calculate IQR. |
Algebraic Expression:
|
|
Hints: |
|
|
|
|
| 4) Problem #PRAJBJW "PRAJBJW - 239556 - Desribe the shape..." |
Desribe the shape of this graph (skewed left, skewed right, symmetric). © STATS4STEM.ORG |
Multiple Choice:
|
| 5) Problem #PRAJBJX "PRAJBJX - 239557 - Which intervals h..." |
A)
Which intervals have a frequency count equal to zero? © STATS4STEM.ORG |
Multiple Choice:
|
|
B)
Which interval or intervals have the greatest frequency count? |
Multiple Choice:
|
|
C)
The 40th percentile is closest to which number? |
Multiple Choice:
|
| 6) Problem #PRAJBJT "PRAJBJT - 31-1-B" |
 What month has the least variablity? State the number or the month in the answer. © STATS4STEM.ORG |
Multiple Choice:
|
|
Hints: |
|
|
|
|
| 7) Problem #PRAJBJZ "PRAJBJZ - Non resistant measurements" |
|
Which of these are non resistant measurements? © STATS4STEM.ORG |
Check All That Apply:
|
| 8) Problem #PRAJBJ2 "PRAJBJ2 - Oprah's Book Club" |
|
Oprah’s book club is having a meeting. There are six women in the room already, ages 33, 34 and 35. There are two woman of each age in the room. If two women, both aged 34 enter the room. © STATS4STEM.ORG |
Multiple Choice:
|
| 9) Problem #PRAJBJ4 "PRAJBJ4 - 239562 - Which is a resist..." |
|
Which is a resistant measure? © STATS4STEM.ORG |
Check All That Apply:
|
|
Hints: |
|
|
| 10) Problem #PRAJBJ5 "PRAJBJ5 - 239563 - {14, 16, 22, 12, ..." |
|
A)
{14, 16, 22, 12, 16, 10, 6, 9, 7, 5, 2, 13, 7} Find the IQR. © STATS4STEM.ORG |
Algebraic Expression:
|
|
Hints: |
|
|
|
|
|
|
|
Q3 = median of new data set 2= 15 |
|
|
|
B)
With the above data, you realized you made a mistake and need to subtract 2 from each number. The new standard deviation will be: |
Multiple Choice:
|
|
C)
Calculate the new mean. Round Answer to the nearest hundredth. |
Algebraic Expression:
|
|
Hints: |
|
|
|
|
|
D)
Calculate the new median |
Algebraic Expression:
|
|
Hints: |
|
|
|
Mnew = 8 |
| 11) Problem #PRAJBKA "PRAJBKA - 239568 - There is a datase..." |
|
There is a dataset of {20, 23, 25, 27, 29, 32}. If the number 26 is added into the dataset then the… © STATS4STEM.ORG |
Multiple Choice:
|
| 12) Problem #PRAJBJR "PRAJBJR - 31-1-B" |
|
The ______________ of a variable tells us what values the variable takes and often it takes these values. © STATS4STEM.ORG |
Exact Match (case sensitive):
|
|
Hints: |
|
|
|
|
| 13) Problem #PRAJBJG "PRAJBJG - 239543 - Using the ..." |
A)
 Using the ogive, locate where the 40th percentile would fall (use an integer answer). © STATS4STEM.ORG |
Algebraic Expression:
|
|
Hints: |
|
|
|
|
|
B)
Using the ogive above, approximate Q3. Use an integer answer. |
Algebraic Expression:
|
|
Hints: |
|
|
|
|
|
|
|
C)
Is the data from the ogive: a) Skewed the the left b) Skewed to the right c) Symmetric |
Multiple Choice:
|
|
Hints: |
|
|
|
|
|
D)
If there is the slope between two points on an ogive is 0, what is true about the data between those two points? (Choose the best answer). a) The values added were too small to show. b) There are no values between those two points. c) The values at all points between those two points are equal. |
Multiple Choice:
|
| 14) Problem #PRAJBJH "PRAJBJH - 239544 - Given a mean 30 a..." |
|
Given a mean 30 and a median 13, we know that the data is: © STATS4STEM.ORG |
Multiple Choice:
|
|
Hints: |
|
|
|
|
|
|
| 15) Problem #PRAJBJK "PRAJBJK - 239546 - Given a data set ..." |
|
A)
Given a data set with: Standard deviation 0.27 Mean 12.8 Median 11 IQR 9.2 Find the new standard deviation transformed by the equation xnew=1.5+3.2x. Round to the nearest hundredths. © STATS4STEM.ORG |
Algebraic Expression:
|
|
Hints: |
|
|
|
|
|
|
|
B)
Find the new mean transformed by the equation xnew=1.5+3.2x. Round to the nearest hundredths. |
Algebraic Expression:
|
|
Hints: |
|
|
|
|
|
|
|
C)
Find the new IQR transformed by the equation xnew=1.5+3.2x. Round to the nearest hundredths. |
Algebraic Expression:
|
|
Hints: |
|
|
|
|
|
|
|
D)
Find the new median transformed by the equation xnew=1.5+3.2x. Round to the nearest hundredths. |
Algebraic Expression:
|
|
Hints: |
|
|
|
|
|
|
| 16) Problem #PRAJBJA "PRAJBJA - 239537 - Valerie has just ..." |
|
A)
Valerie has just finished a volleyball match. Her scores obtained from each round are found below. 8 9 3 5 6 7 a) Calculate the mean. Round to the nearest hundredths. © STATS4STEM.ORG |
Algebraic Expression:
|
|
Hints: |
|
|
|
B)
b) Calculate the variance. Round to the nearest hundredths. |
Algebraic Expression:
|
|
Hints: |
|
σ2 = ((x1 - mean)2) + ((x2 - mean)2) + ((x3 - mean)2) ... / (n - 1) |
|
|
| 17) Problem #PRAJBKY "PRAJBKY - 239589 - The number of hom..." |
|
A)
The number of home runs hit by a player in his first 10 seasons: 20, 29, 55, 25, 29, 18, 37, 42, 63, 48 a) Find the mean of the data. © STATS4STEM.ORG |
Algebraic Expression:
|
|
Hints: |
|
Then divide the sum of all the numbers by 10. |
|
|
|
B)
b) Find the standard deviation of the data by hand. The formula for the standard deviation is: σ=√∑(x-mean)²⁄n-1 Round answer to the nearest hundredth. |
Algebraic Expression:
|
|
Hints: |
|
|
|
|
|
C)
c) Find Q1, M, Q3, and the IQR |
Multiple Choice:
|
|
Hints: |
|
|
|
|
| 18) Problem #PRAJBKX "PRAJBKX - OGIVE" |
The number of mintutes students would read per night is displayed in the OGIVE. Using the graph below, estimate the 75 percentile? Provide answer as a whole number.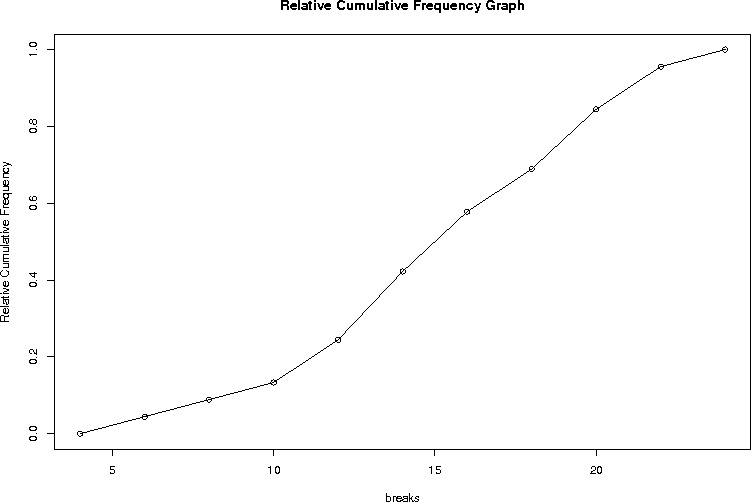 © STATS4STEM.ORG |
Exact Match (case sensitive):
|
|
Hints: |
|
|
|
|
|
|
| 19) Problem #PRAHNH7 "PRAHNH7 - 219353 - Use the bacteria ..." |
|
A)
Use the bacteria dataset to complete the following questions. About the data: Purified water is used in one step in the production of a medical device. The water is tested daily for bacteria. These data are the results from 50 days of testing. They are the counts of a particular strain of bacteria in a 100 ml. sample of water. Using R, create a histogram of the variable level. After viewing the histogram, one can say that the variable level is: © STATS4STEM.ORG |
Multiple Choice:
|
|
Hints: |
|
library(EngrExpt); data(bacteria); attach(bacteria) hist(level) |
|
B)
The variable level is skewed to the right. Therefore we can say the following about the bacterial level: |
Check All That Apply:
|
|
C)
Using Rweb, calculate the mean of level. |
Algebraic Expression:
|
|
Hints: |
|
library(EngrExpt); data(bacteria); attach(bacteria) mean(level) |
|
|
|
D)
Using Rweb, calculate the median for the variable level. |
Algebraic Expression:
|
|
Hints: |
|
### Copy and paste the following code into the Rweb window. library(EngrExpt); data(bacteria); attach(bacteria) median(level) |
|
|
E)
Below is a cumulative frequency graph for the bacterial level. Using the relative frequency graph, estimate the 25th percentile. |
Multiple Choice:
|
|
F)
Using Rweb, calculate the first quartile for the variable level. |
Algebraic Expression:
|
|
Hints: |
|
library(EngrExpt); data(bacteria); attach(bacteria) quantile(level, .25) |
|
|
| 20) Problem #PRAJBKJ "PRAJBKJ - 239576 - Data: 10, 41, 46,..." |
|
A)
Data: 10, 41, 46, 50, 52, 58, 62, 70, 100 What is the 5 number summary of the data set? © STATS4STEM.ORG |
Multiple Choice:
|
|
Hints: |
|
|
|
|
|
B)
What is the IQR of the data set? |
Algebraic Expression:
|
|
Hints: |
|
|
|
|
|
|
|
|
|
C)
Are there any outliers? If so, what? If there are no outliers - type 0 |
Algebraic Expression:
|
|
Hints: |
|
|
|
|
|
|
|
|
|
|
|
|
| 21) Problem #PRAJBKR "PRAJBKR - Question 4" |
|
A)
The mean score on Mr. Simoneau's test was 78, with an IQR of 20. If he adds 12 points to everyone's score, what's the new mean? © STATS4STEM.ORG |
Algebraic Expression:
|
|
Hints: |
|
|
|
Therefore, new mean = E(1X+12) = (1)E(X) + 12 = (1)(78) + 12 |
|
|
|
|
|
B)
What is the new IQR? |
Algebraic Expression:
|
|
Hints: |
|
|
|
|
| 22) Problem #PRAJQUU "PRAJQUU - 251365 - There is a datase..." |
|
There is a dataset of {20, 23, 25, 27, 29, 32}. If the number 100 is added into the dataset then the: © STATS4STEM.ORG |
Multiple Choice:
|
| 23) Problem #PRAJRH9 "PRAJRH9 - 252029 - The following box..." |
A)
The following boxplots represent the maximum daily temperature in degrees Fahrenheit at La Guardia Airport.  Which month has the greatest median? © STATS4STEM.ORG |
Multiple Choice:
|
|
B)
The 75th percentile is greatest for which month? |
Multiple Choice:
|
|
Hints: |
|
|
C)
Below is a numerical summary of the temperature data for the month of May. Based on the data above, any number that is found to be greater than what number will be considered an outlier? In other words, what is the upper threshold number that should be used to determine if a number is an outlier or not. Round answer to the nearest hundredth. |
Algebraic Expression:
|
|
Hints: |
|
|
|
|
|
|
|
|
D)
Below is a numerical summary of the temperature data for the month of July.  Based on the data above, any number that is found to be lower than what number will be considered an outlier? In other words, what is the lower threshold number that should be used to determine if a number is an outlier or not. Round answer to the nearest hundredth. |
Algebraic Expression:
|
|
Hints: |
|
|
|
|
|
|
|
|
| 24) Problem #PRAJ74B "PRAJ74B - 266012 - The following box..." |
A)
The following boxplots represent the fuel efficiency of different types of cars in miles per gallon.  Which type of car has the greatest median? © STATS4STEM.ORG |
Multiple Choice:
|
|
Hints: |
|
|
|
B)
The 75th percentile is least for which car type? |
Multiple Choice:
|
|
Hints: |
|
|
C)
Below is a numerical summary of the MPG.city data for small cars.
Based on the data above, any number that is found to be greater than what number will be considered an outlier? In other words, what is the upper threshold number that should be used to determine if a number is an outlier or not. Round answer to the nearest hundredth. |
Number:
|
|
Hints: |
|
|
|
|
|
|
|
|
D)
Below is a numerical summary of the MPG.city data for large cars.
Based on the data above, any number that is found to be lower than what number will be considered an outlier? In other words, what is the lower threshold number that should be used to determine if a number is an outlier or not. Round answer to the nearest hundredth. |
Number:
|
|
Hints: |
|
|
|
|
|
|
|
|
| 25) Problem #PRAJ75F "PRAJ75F - 266047 - The mammals datas..." |
A mammals dataset contains data with average brain and body weights for 62 species of land mammals. The summary statistics for the brain weights in grams are found below: Given the summary statistics, one can conclude that this data set is: © STATS4STEM.ORG |
Multiple Choice:
|
| 26) Problem #PRAKMY6 "PRAKMY6 - 278407 - The following box..." |
The following boxplot pertains to the Min.Price variable from the carprice dataset. This dataset is: © STATS4STEM.ORG |
Multiple Choice:
|
| 27) Problem #PRAKMUY "PRAKMUY - 278277 - The following num..." |
|
The following numerical summary pertains to the Min.Price variable from the carprice dataset. This distribution is: © STATS4STEM.ORG |
Multiple Choice:
|
| 28) Problem #PRAP7SR "PRAP7SR - Problem #384879" |
A)
Data from a foster feeding experiment with rat mothers and litters of four different genotypes: A, B, I and J. Rat litters were separated from their natural mothers at birth and given to foster mothers to rear.The data and details regarding this dataset can be found here.  Which litter genotype has the largest Interquartile Range (IQR)? © STATS4STEM.ORG |
Multiple Choice:
|
|
B)
Which litter genotype has the smallest 1st Quartile (Q1)? |
Multiple Choice:
|
|
C)
Which litter genotype seems to be the most symmetric? |
Multiple Choice:
|
|
D)
Which litter genotype has the smallest Interquartile Range (IQR)? |
Multiple Choice:
|
| 29) Problem #PRAP7TT "PRAP7TT - 239568 - There is a datase..." |
|
A)
There is a dataset of {1,2,3,3,4}. If the number 5 is added to the dataset, then we can say: © STATS4STEM.ORG |
Multiple Choice:
|
|
B)
If the numbers 10, 12, and 13 are added to the dataset from above, then we can say: |
Multiple Choice:
|
| 30) Problem #PRARDSE "PRARDSE - Problem #419904" |
A)
The side-by-side boxplot below was created using Michelson's Speed of Light dataset. This data represents measurements of the speed of light in air, made between 5th June and 2nd July, 1879. The data consists of five experiments, each consisting of 20 consecutive runs. From the boxplot, one can see that the experiment with the largest IQR is: © STATS4STEM.ORG |
Multiple Choice:
|
|
B)
The experiment with the lowest 1st quartile is: |
Multiple Choice:
|